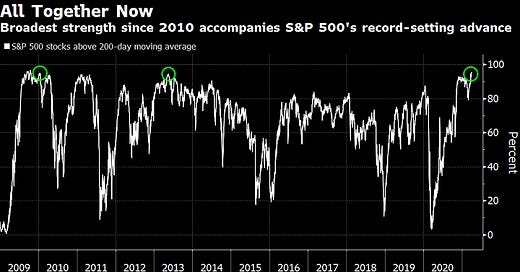
S&P 500 Indicator Signals Broadest Strength in 11 Years
The rally that has lifted the S&P 500 Index above 4,000 for the first time is unusually broad. That’s evident from the percentage of the index’s component stocks that closed higher than their 200-day moving average, a gauge of price trends. Last week’s readings peaked at 94.4%, the highest since January 2010, according to data compiled by Bloomberg. They were the first to surpass 94% since May 2013 and contrasted with levels as low as 3.2% in March 2020.


